
COVID-19 has been lasting for more than a year now, and I didn’t find a good time to make a road trip as before during the quarantine time. However, it’s not a bad idea to plan a trip with the case number winding down.
What is this tool?
Recently, when I was checking the National Parks information, I came out with an idea if a dashboard can provide me some information for the National Park and how far and how long it will take me to drive there. After hours of research and troubleshooting, I finally created a dashboard with the information I need with embedded web objects and action functions.
The Dashboard below includes three components, National Parks Map with information as tooltips(Top Right), Additional park information from us-parks.com (Top Left), and a google map to show how long the road trip will take (Bottom Left). The other visualizations will show related information by clicking the National Park located on the top left map.

Note: Please click the ![]() button on the bottom right corner of the dashboard to enter the full-screen mode for a better experience.
button on the bottom right corner of the dashboard to enter the full-screen mode for a better experience.
How was this tool made?
National Park Map Visual
The data of 63 national parks is from Wikipedia(link). I copied the table and wrangled the data a little bit to make the coordinates into a Tableau-readable format. The tooltip shows all the information I got from Wikipedia, including park name, park size, coordinates, description, and state. And the dot size on the map visual represents the park size, the larger point, the bigger park.
National Park Introduction Visual
I found the URL pattern of the introduction page on US-Parks.com, which makes the second visual way much easier. Besides few exceptions, most park introduction page URLs are consistent, following the format like: https://www.us-parks.com/<National Park Name>-national-park.html. Either use the park name as a parameter in the URL or simply create a column in the raw dataset works, since the URL requires each word connected with a hyphen. I chose to create a column in .csv to save some time.
Driving distance/time Visual
Embed a google map into the dashboard is easy, but if you want to calculate the driving time and distance from where you are to any parks you click, need a little more work. In order to make this work, you have to create an Action (Dashboards-Actions-Add Action-Go to URL) after you embed the map. Make sure you change the Run action on to Select and choose the right Source Sheet, which you will use to click the parks.
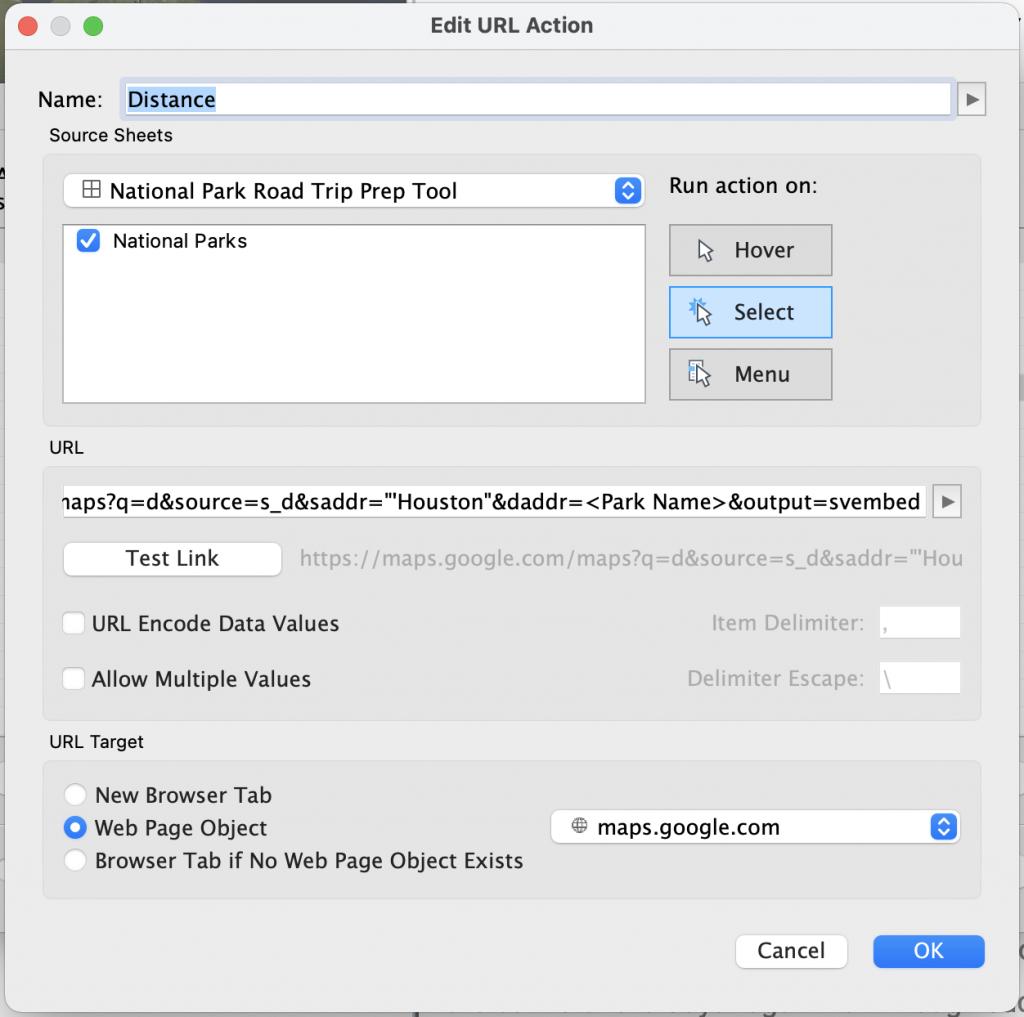
Then fill out the URL below. This is the part took me a while to make it work, not because of creating it is hard, I keep having the issue that the Google Maps works perfectly in the Tableau Desktop but after I published it to Tableau Public, only this Google Map visual won’t show up. After hours of research and troubleshooting, I found out it is the compatibility issue of google visual, I have to add additional command in the URL to make this work. You can use the following URL and change the two locations, but make sure you added this “&output=svembed” at the very end of the URL:
https://maps.google.com/maps?q=d&source=s_d&saddr="<Your Location>"&daddr=<Destination>&output=svembedThe last step in this screen is to select Web Page Object, change it to maps.google.com, and click OK.
Then you have it, a cool tool to help you calculate the driving distance and time based on the location you select.
Although I really want to go to Acadia National Park, the about 20-hours-drive really makes me think it twice. Really wish there are more national parks near Houston, as least in Texas. 🙁